Data Analytics – From Excel to Python, Power BI & ML Basics
- Home
- Data Analytics – From Excel to Python, Power BI & ML Basics

Data Analytics – From Excel to Python, Power BI & ML Basics
The Data Analytics course is designed to equip learners with end-to-end data analysis skills using Excel, SQL, Python, Power BI, and Machine Learning basics. It blends data cleaning, processing, visualization, and predictive analytics – ideal for beginners, freshers, and professionals aiming to become data-driven decision-makers or enter analytics careers.
- Data Analysis & Visualization
- Statistical & Predictive Techniques
- Hands-On with Real Datasets
Course Information
Course Duration
60 Days
Placement Support
1 Year
Students Placed
540+
Course Information
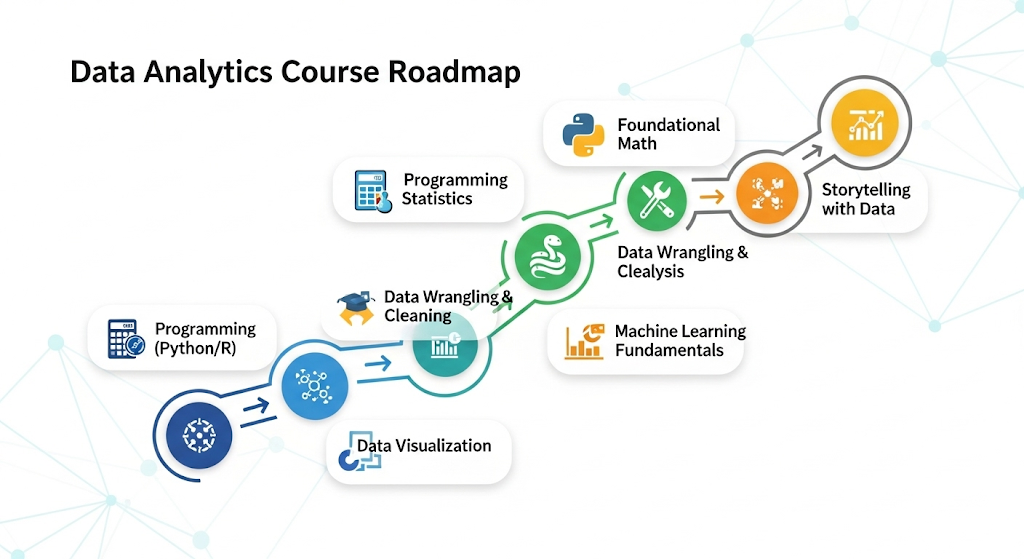
This comprehensive Data Analytics course provides practical training on data handling and visualization tools used by analysts and decision-makers. You’ll begin with Excel and statistics, build database skills with SQL, advance to Python programming for data manipulation, and learn to create interactive dashboards in Power BI. It also introduces Machine Learning basics for predictive analysis and MIS reporting for structured business reporting.
By the end of the course, you’ll be confident in analyzing real-time business data and building data dashboards for impactful insights.
Tech Stack Covered :
Data Analysis & Visualization Tools:
Microsoft Excel (Advanced):
Perform data cleaning, use pivot tables, charts, dashboards, VLOOKUP/XLOOKUP, and macros for reporting.
SQL (Structured Query Language):
Query databases, perform joins, filters, subqueries, and aggregations to extract and analyze business data.
Statistics for Data Analysis:
Understand measures of central tendency, dispersion, correlation, regression, hypothesis testing, and statistical decision-making.
Python for Data Analytics:
Use Python with libraries like Pandas, NumPy, and Matplotlib to process and visualize large datasets efficiently.
Power BI:
Build and publish professional dashboards and interactive visualizations to communicate insights clearly.
Machine Learning (ML) Basics:
Introduction to Machine Learning
Supervised vs Unsupervised Learning
Real-world use cases (like predicting sales or customer churn)
Hands-on: Building your first simple ML model using Python’s Scikit-learn
Note: This module focuses on ML concepts and introductory level implementation suitable for analysts, not deep ML engineering.
MIS (Management Information Systems) Basics:
Overview of MIS in organizations
Creating automated Excel reports for business operations
Designing monthly/weekly MIS dashboards using Excel & Power BI
Real-time examples: Sales MIS, HR MIS, Finance MIS
Tools & DevOps:
VS Code / Jupyter Notebook / Excel
Git & GitHub – Version control and sharing code/data notebooks
PostgreSQL/MySQL Workbench – SQL Practice
Power BI Desktop – Data modeling & dashboard publishing
Job Roles
- Data Analyst
- Business Analyst
- MIS Executive
- Python Analyst
- Junior Data Scientist (with ML basics)
- Power BI Developer
- Reporting Analyst
- SQL Data Analyst
Salary in Data Analytics
For Freshers (0–1 year experience):
Job Role
Data Analyst
MIS Executive
Business Analyst
Average Salary (INR)
₹3.0 – ₹4.5 LPA
₹2.5 – ₹4.0 LPA
₹3.5 – ₹5.0 LPA
Top Range (INR)
Up to ₹6.0 LPA
Up to ₹5.0 LPA
Up to ₹6.5 LPA
Mid-Level (1–3 years experience):
Job Role
Data Analyst
Power BI Developer
Business Analyst
Average Salary (INR)
₹5.0 – ₹7.5 LPA
₹5.5 – ₹7.5 LPA
₹6.0 – ₹8.0 LPA
Top Range (INR)
Up to ₹9.0 LPA
Up to ₹9.0 LPA
Up to ₹10.0 LPA
Senior Level (4+ years experience):
Job Role
Senior Data Analyst
Business Intelligence Lead
Average Salary (INR)
₹8.0 – ₹12.0 LPA
₹10.0 – ₹15.0 LPA
Top Range (INR)
₹15.0 LPA+
₹18.0 LPA+
Upcoming Batches
23 Aug 2025 - Weekday Batch
23 Aug 2025 - Weekday Batch
Enquire Now!

Expert Consulting | IT & Non-IT Placements
Empowering Talent | Shaping Futures
Contact
Plot no. : 188, 8th St, Kamakoti Nagar, Pallikaranai, Chennai, Tamil Nadu 600100
info@tidalcrown.com
+91 8525800006
Copyright © 2025 TidelCrown
